
April 20, 2026

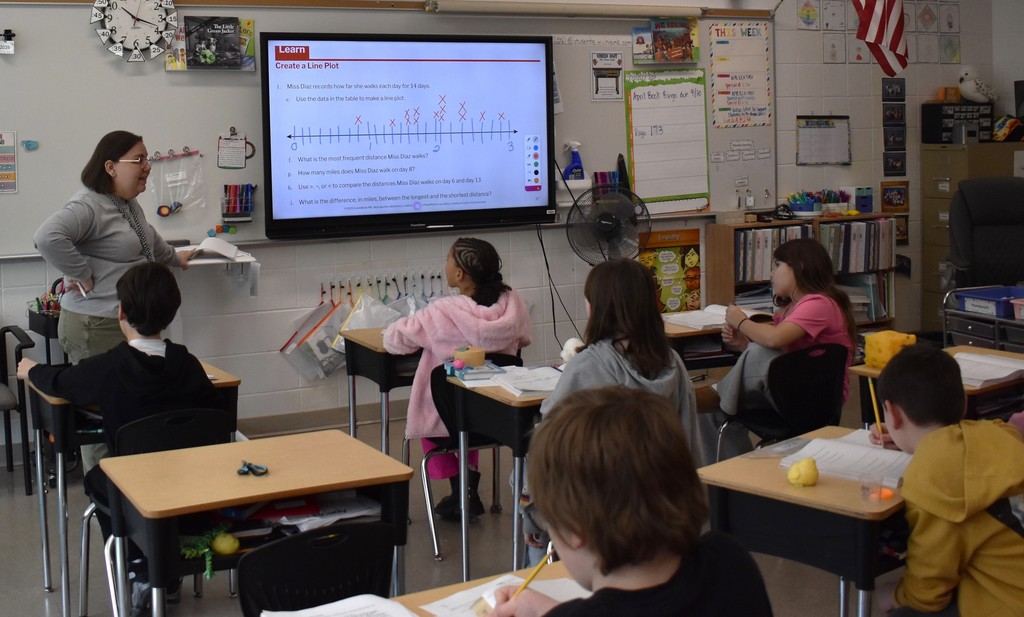
Like all district fourth-graders, Jenna Colman’s Otisville fourth-graders are learning about line plots!
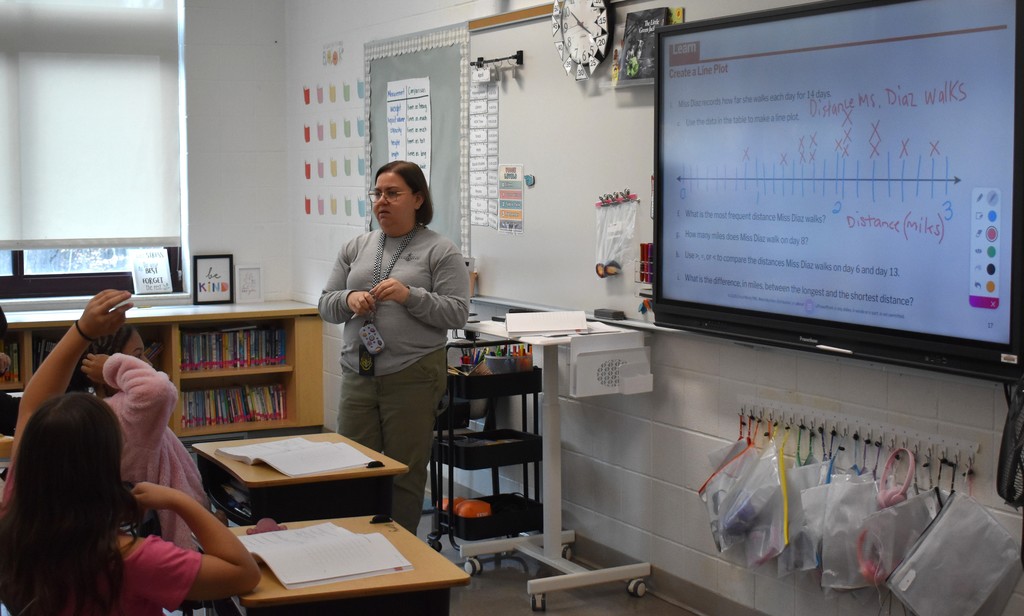
Line plots utilize a data table that shows different information based on what was collected. Students recently completed a fraction unit where they placed fractions on a number line. In this recent lesson, one selection of data was collected based on the distance someone walked in miles over the course of a number of days. Some of that data was shown in fractions or mixed numbers. Using their knowledge of fractions on a number line, students analyzed the data to set their points on the number line and plotted all of their data on the number line.
A line plot is a simple type of graph that fourth graders use to show how often different values appear in a set of data. It is made by drawing a number line and placing X’s above each number to represent how many times that value occurs. Line plots help students organize information, compare values, and answer questions about the data. They’re especially useful for working with measurements and fractions while developing skills in reading and interpreting graphs.